
Business intelligence & analytics
Drill from metrics to transactions on live warehouse data, then reuse shared datasets and models so teams stay aligned.
Request a DemoLive access to every single row
Analyze billions of rows down to the individual transaction. Queries run directly on the warehouse, giving you the granular "why" behind every metric without needing any extracts.
Spreadsheet ease with scalable results
Harness the full power of your cloud data warehouse through the familiar spreadsheet UI. Perform lookups and pivots on billions of rows of live data without any row limitations.
Move seamlessly from insight to action
Break down technical barriers by using formulas, code, or natural language in one unified workspace. Move from data exploration to execution instantly by choosing the tool that works best for you.
Trusted by finance and corporate strategy teams at leading global enterprises


Built for how you actually work
A unified workspace for all users.
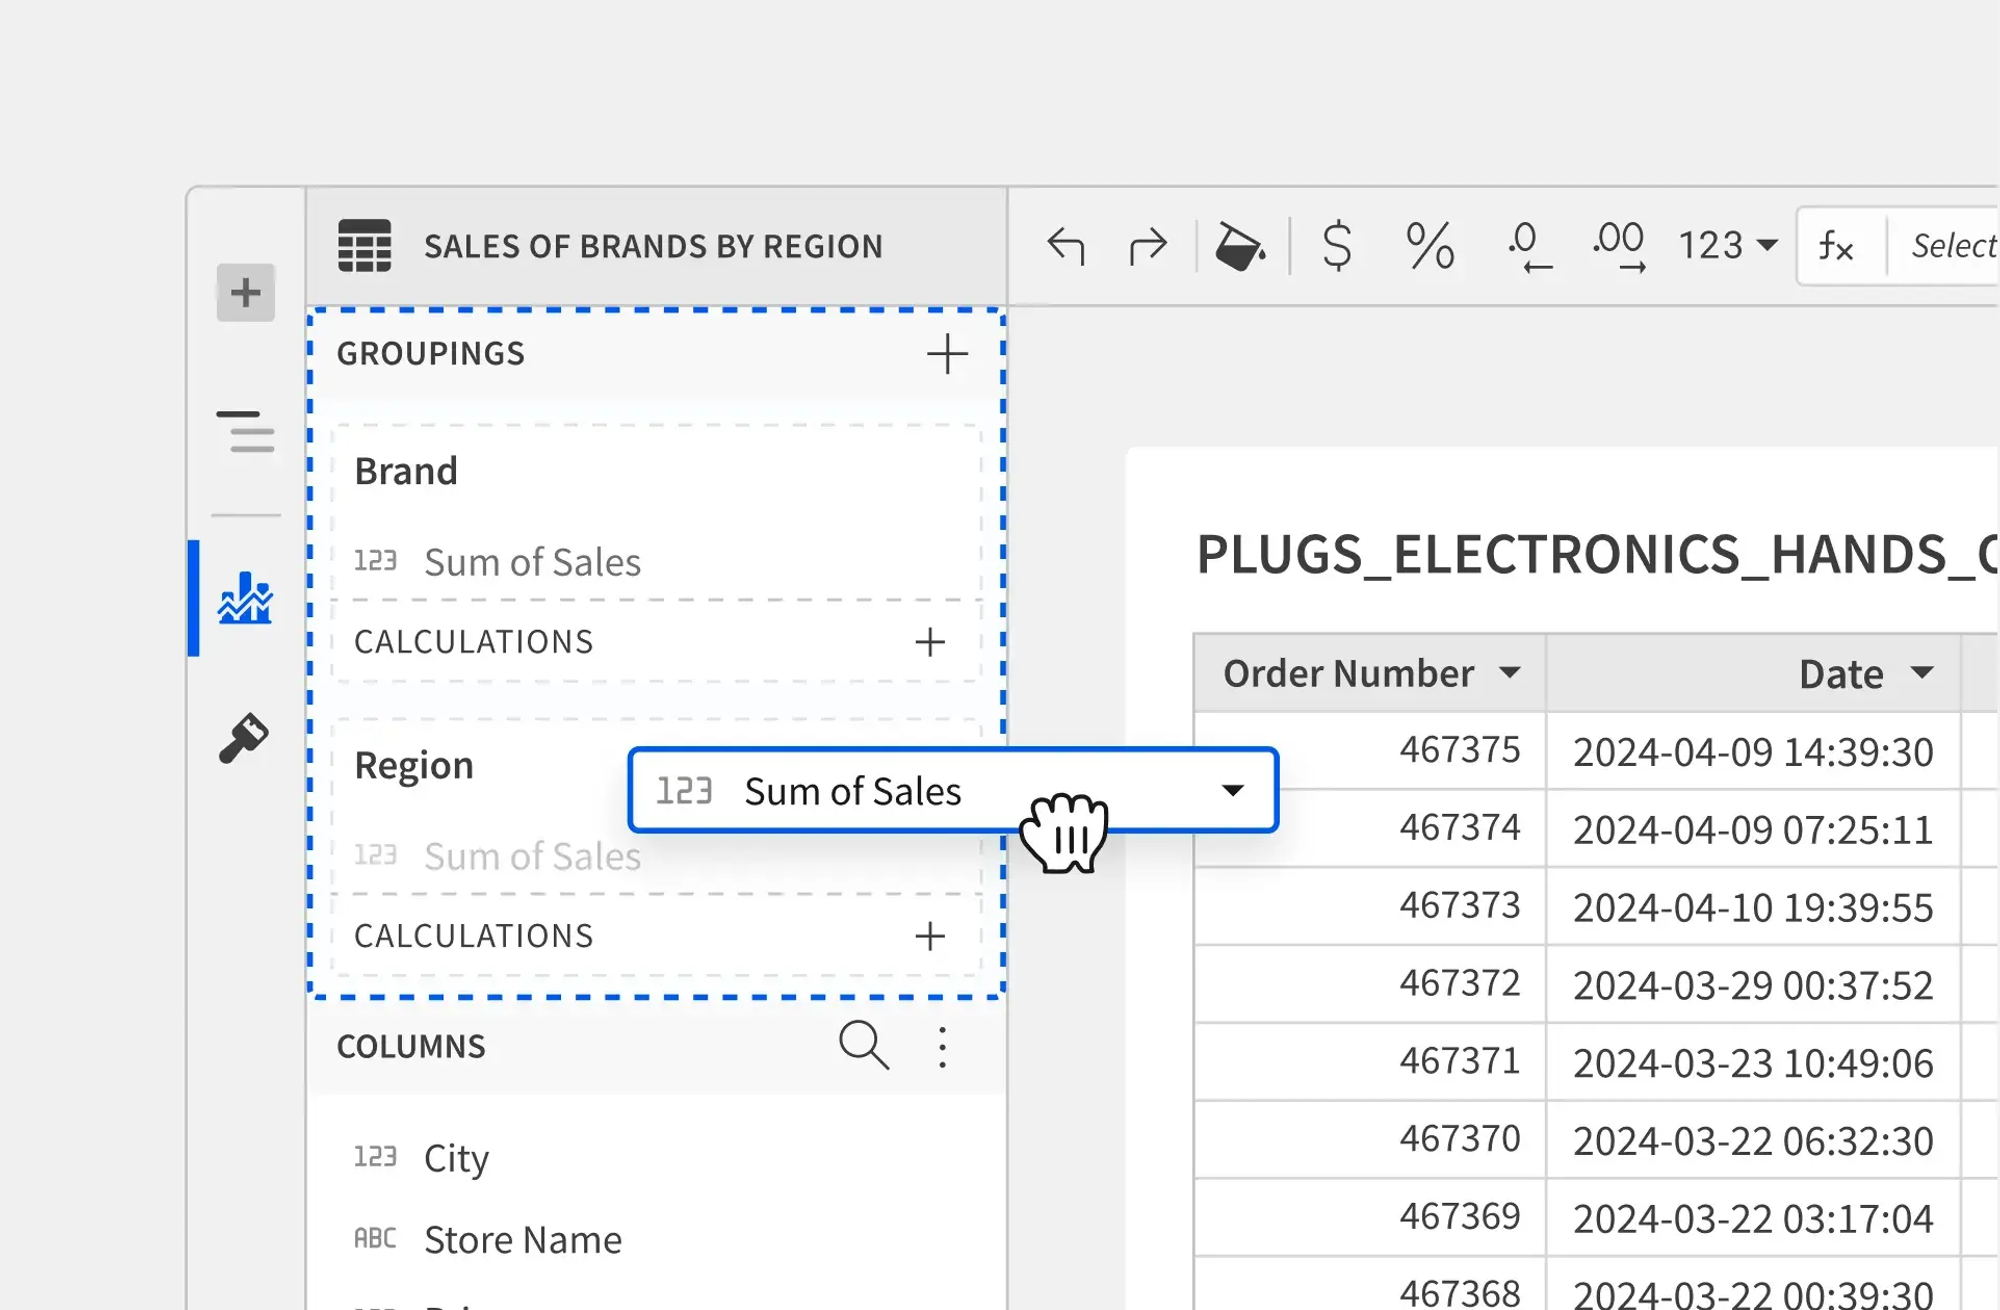
SPREADSHEET UI
Spreadsheet logic meets SQL power
Analyze warehouse data using the interface you already know. Type formulas, add columns, and pivot data—and Sigma will translate every action into optimized SQL for you.
- Excel-Native Logic: Use standard Excel-like formulas on live data
- Billion-Row Pivots: Aggregate billions of rows instantly with drag-and-drop ease.
- Cell-Level Control: Format and calculate data at the lowest level of granularity.
VISUAL ANALYTICS
A connected canvas for your data
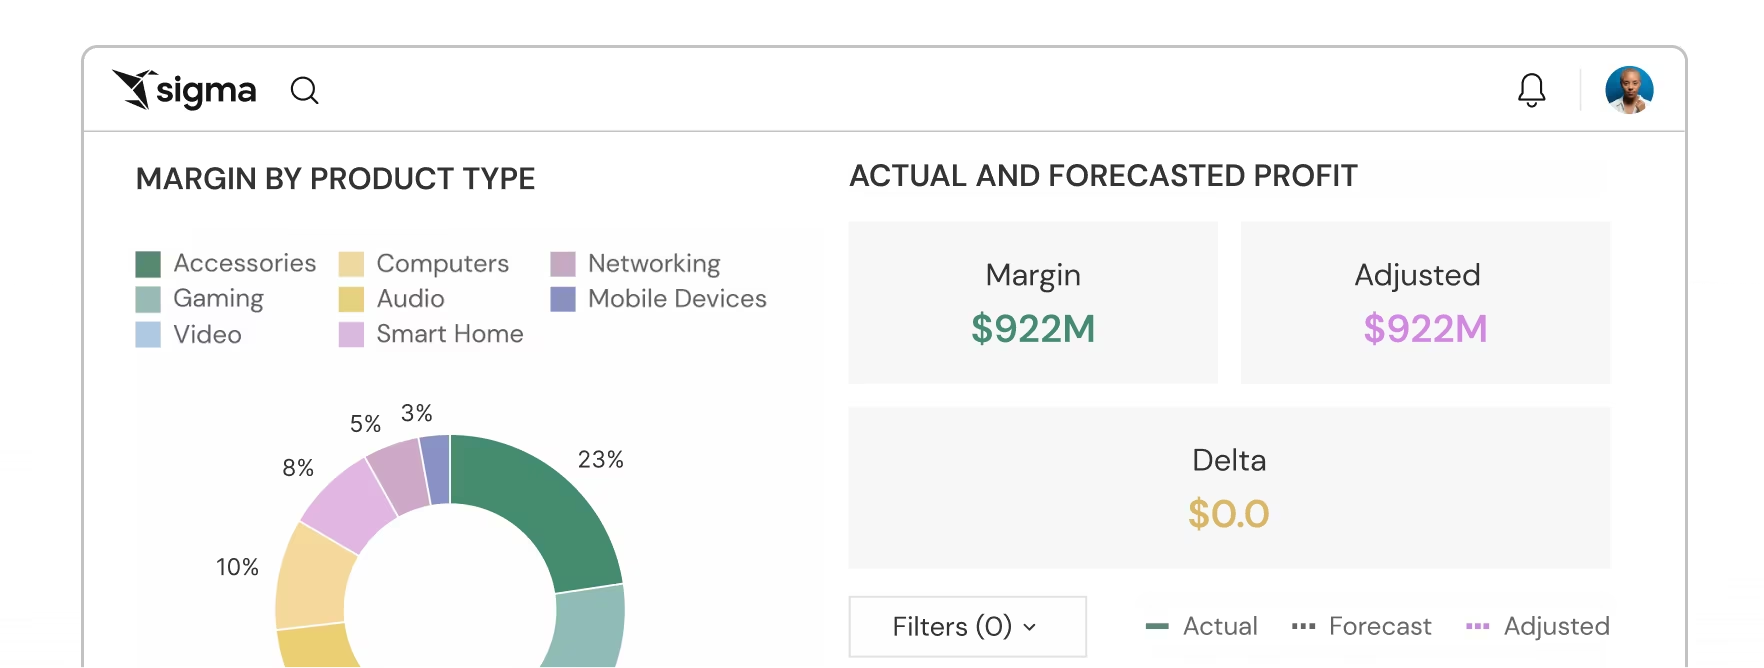
Click on any chart element to drill down into the underlying records or pivot to a new dimension. No pre-defined paths required.
- Unrestricted Drilling: Explore data hierarchies dynamically without setup
- Linked Visuals: Automatically update the entire dashboard by filtering one chart.
- Rich Library: Choose from dozens of chart types, from Sankey diagrams to geospatial maps
SIGMA REVEAL
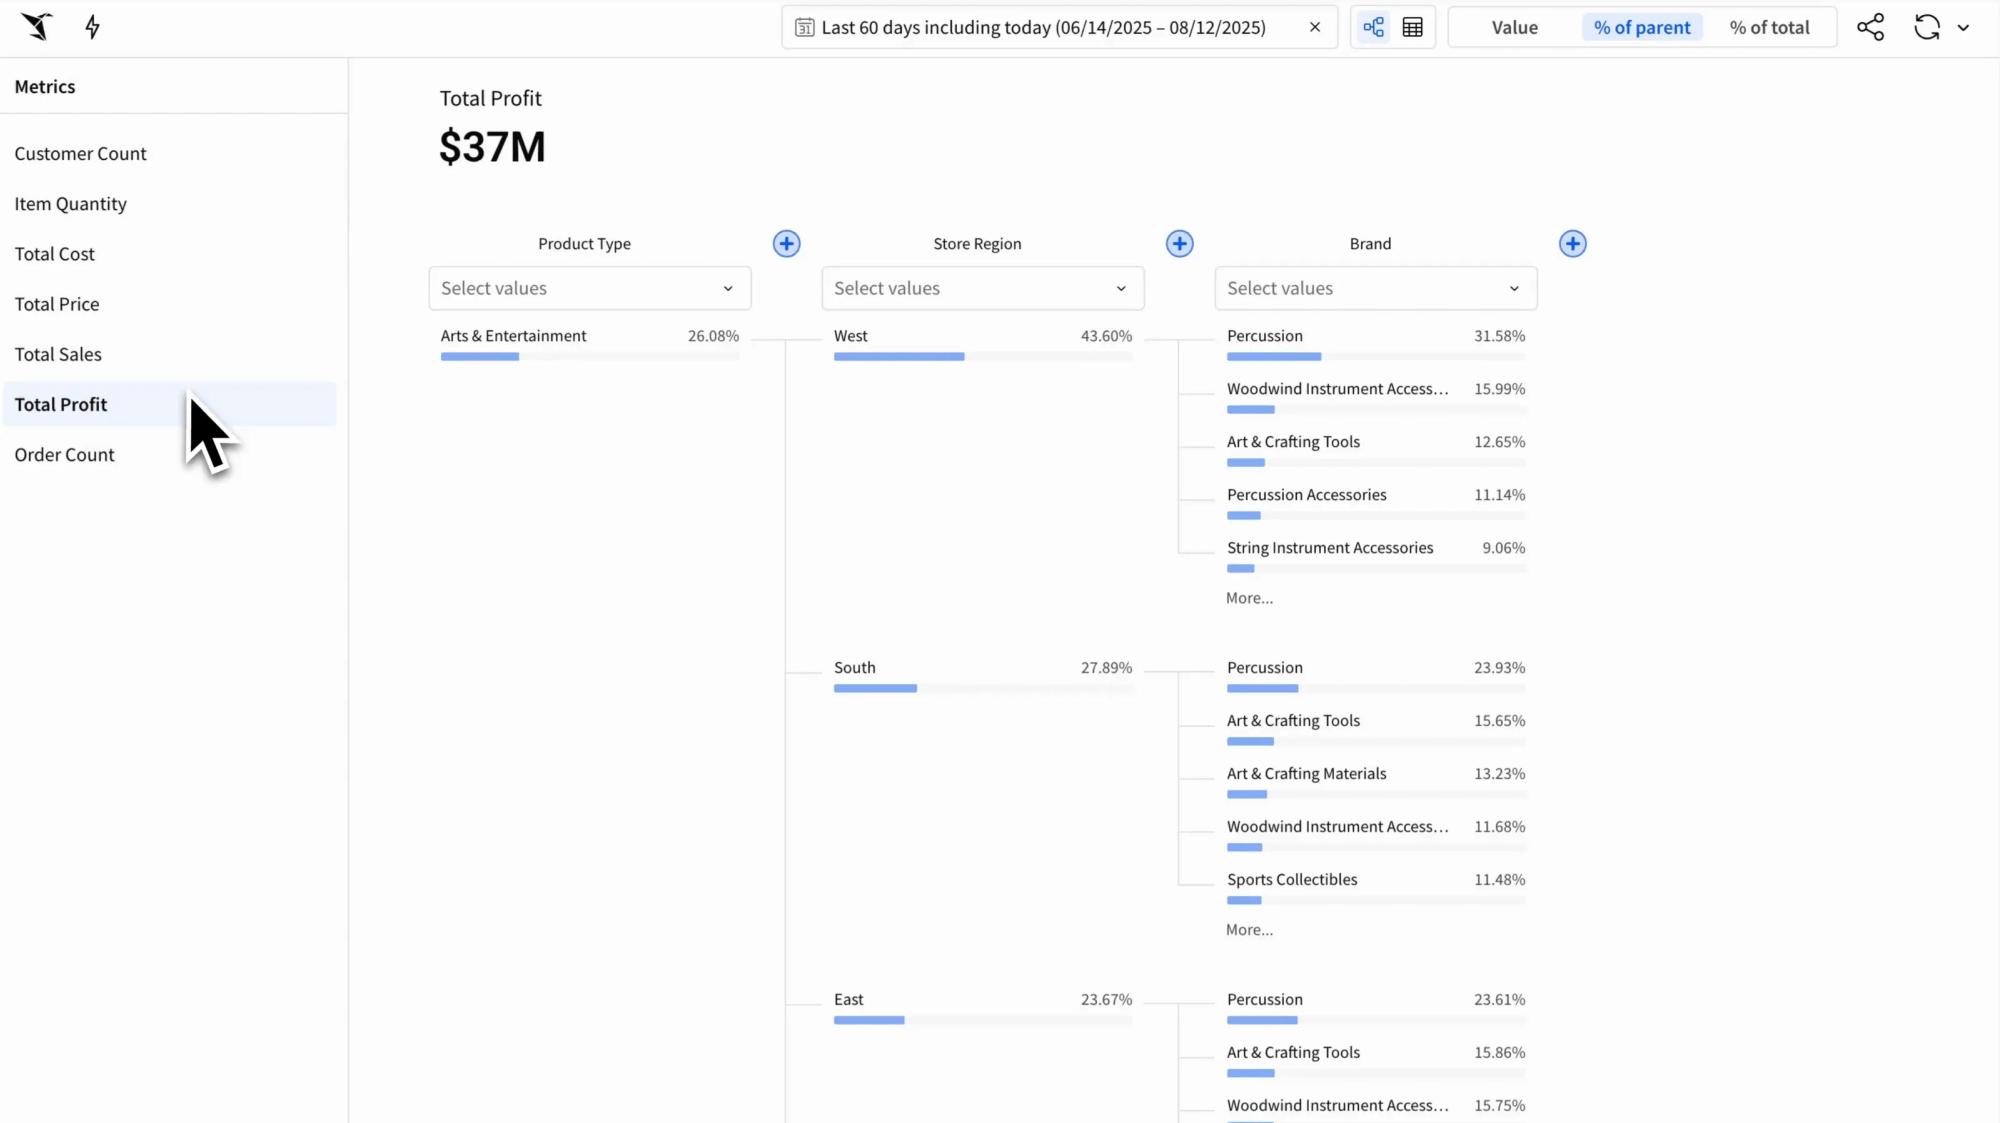
Flexible exploration without pre-built queries
Start reacting to your data in real time. Pivot, group, and drill into live data to uncover unexpected patterns without pre-modeling a single query.
- Direct Manipulation: Click, drag, and pivot data directly to see new insights emerge instantly.
- Context Retention: Keep your analysis path visible with breadcrumbs that track every grouping and filter.
- Zero-Model Exploration: Ship interactive experiences faster without needing to pre-define every possible path for user analysis.
SQL & PYTHON
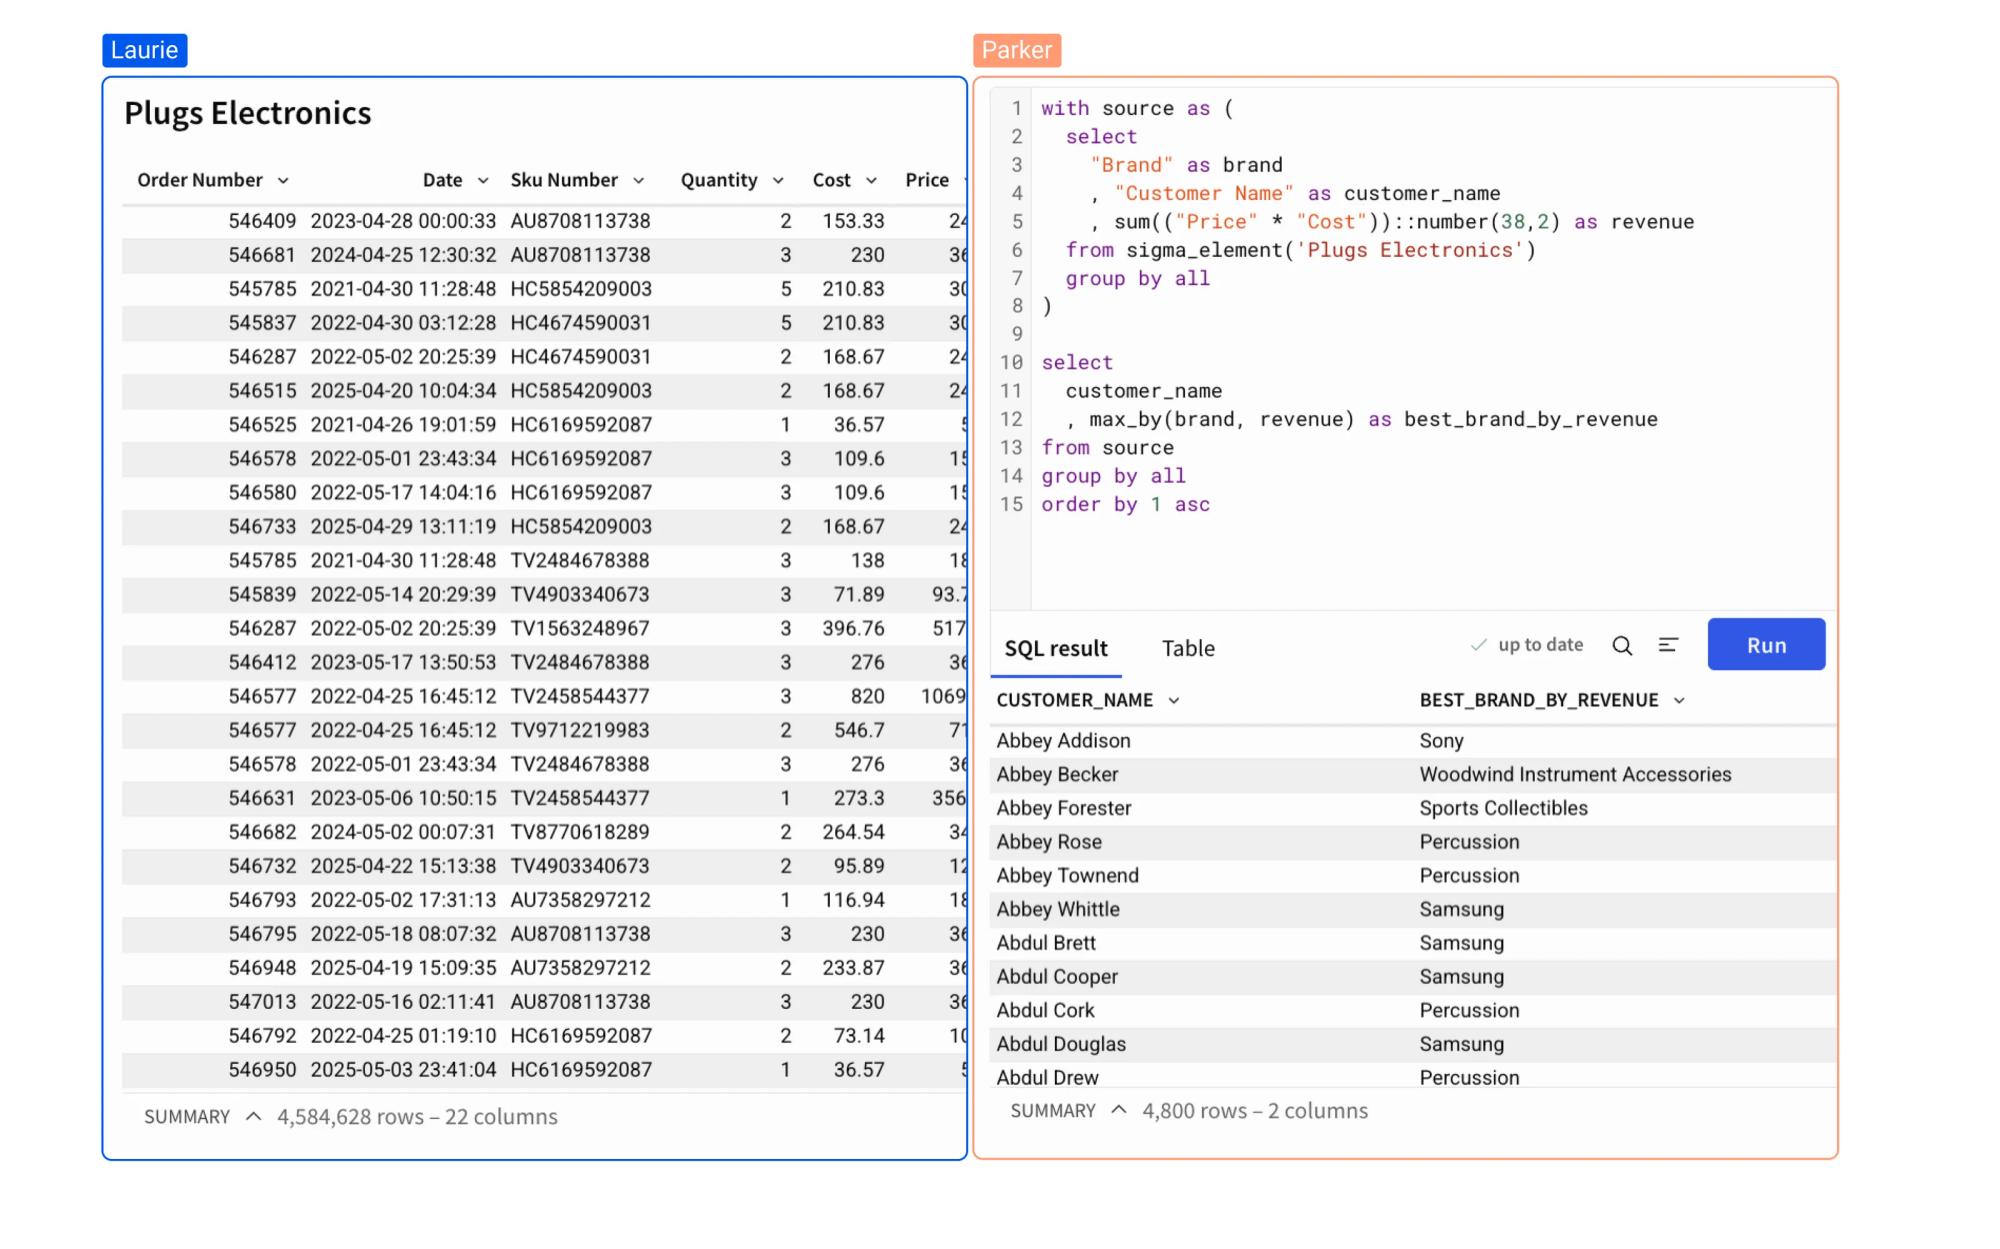
Code and click in harmony
Bridge the gap between technical and business teams. Use SQL and Python for complex modeling, then let anyone explore the results in a singular app or workbook.
- Integrated Code Elements: Write custom SQL or Python directly in your workbook.
- Cross-Element Variables: Reference values across SQL, Python, and UI elements for cohesive, complex analyses.
- Interactive Handoff: Turn code-driven models into flexible tables that non-technical users can pivot and filter.
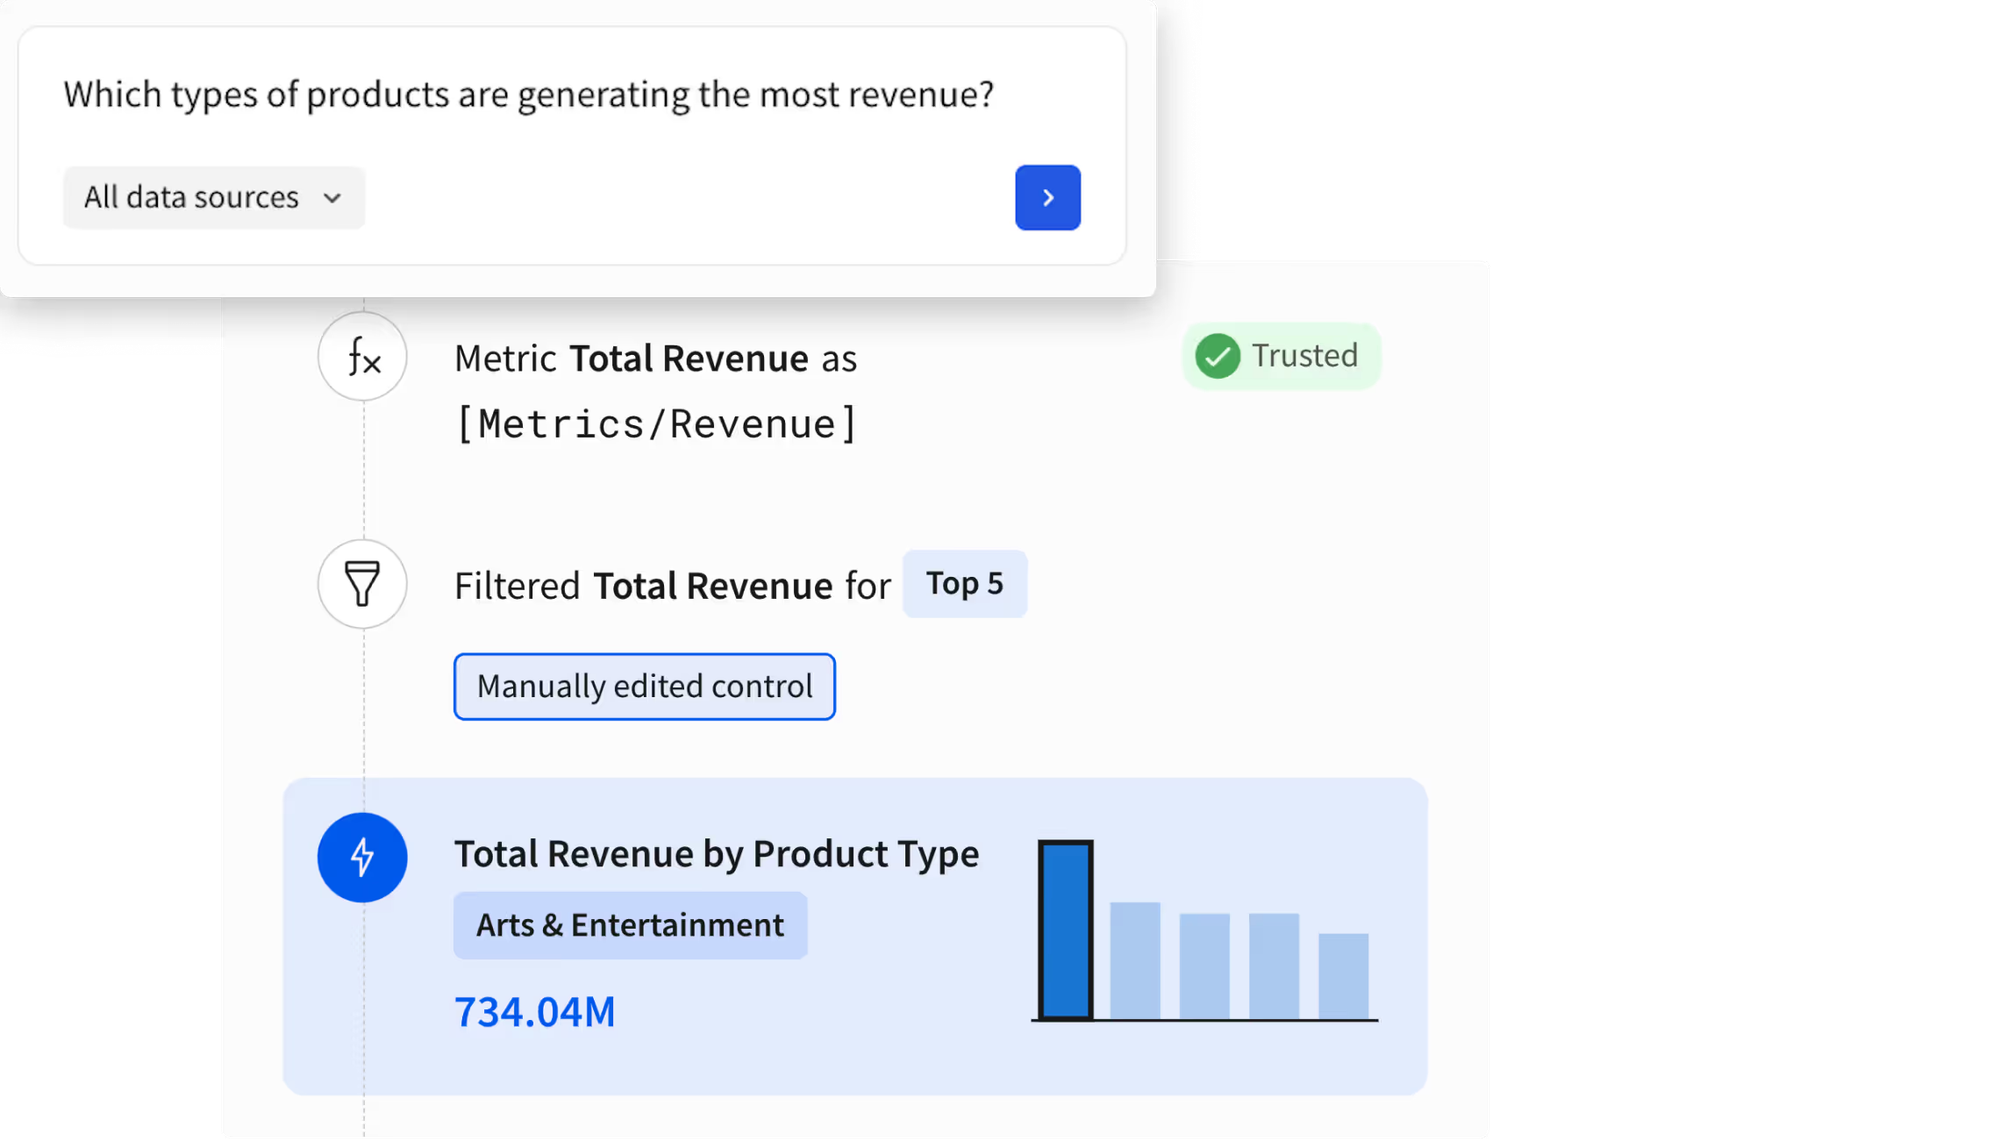
ASK SIGMA
Chat with your data
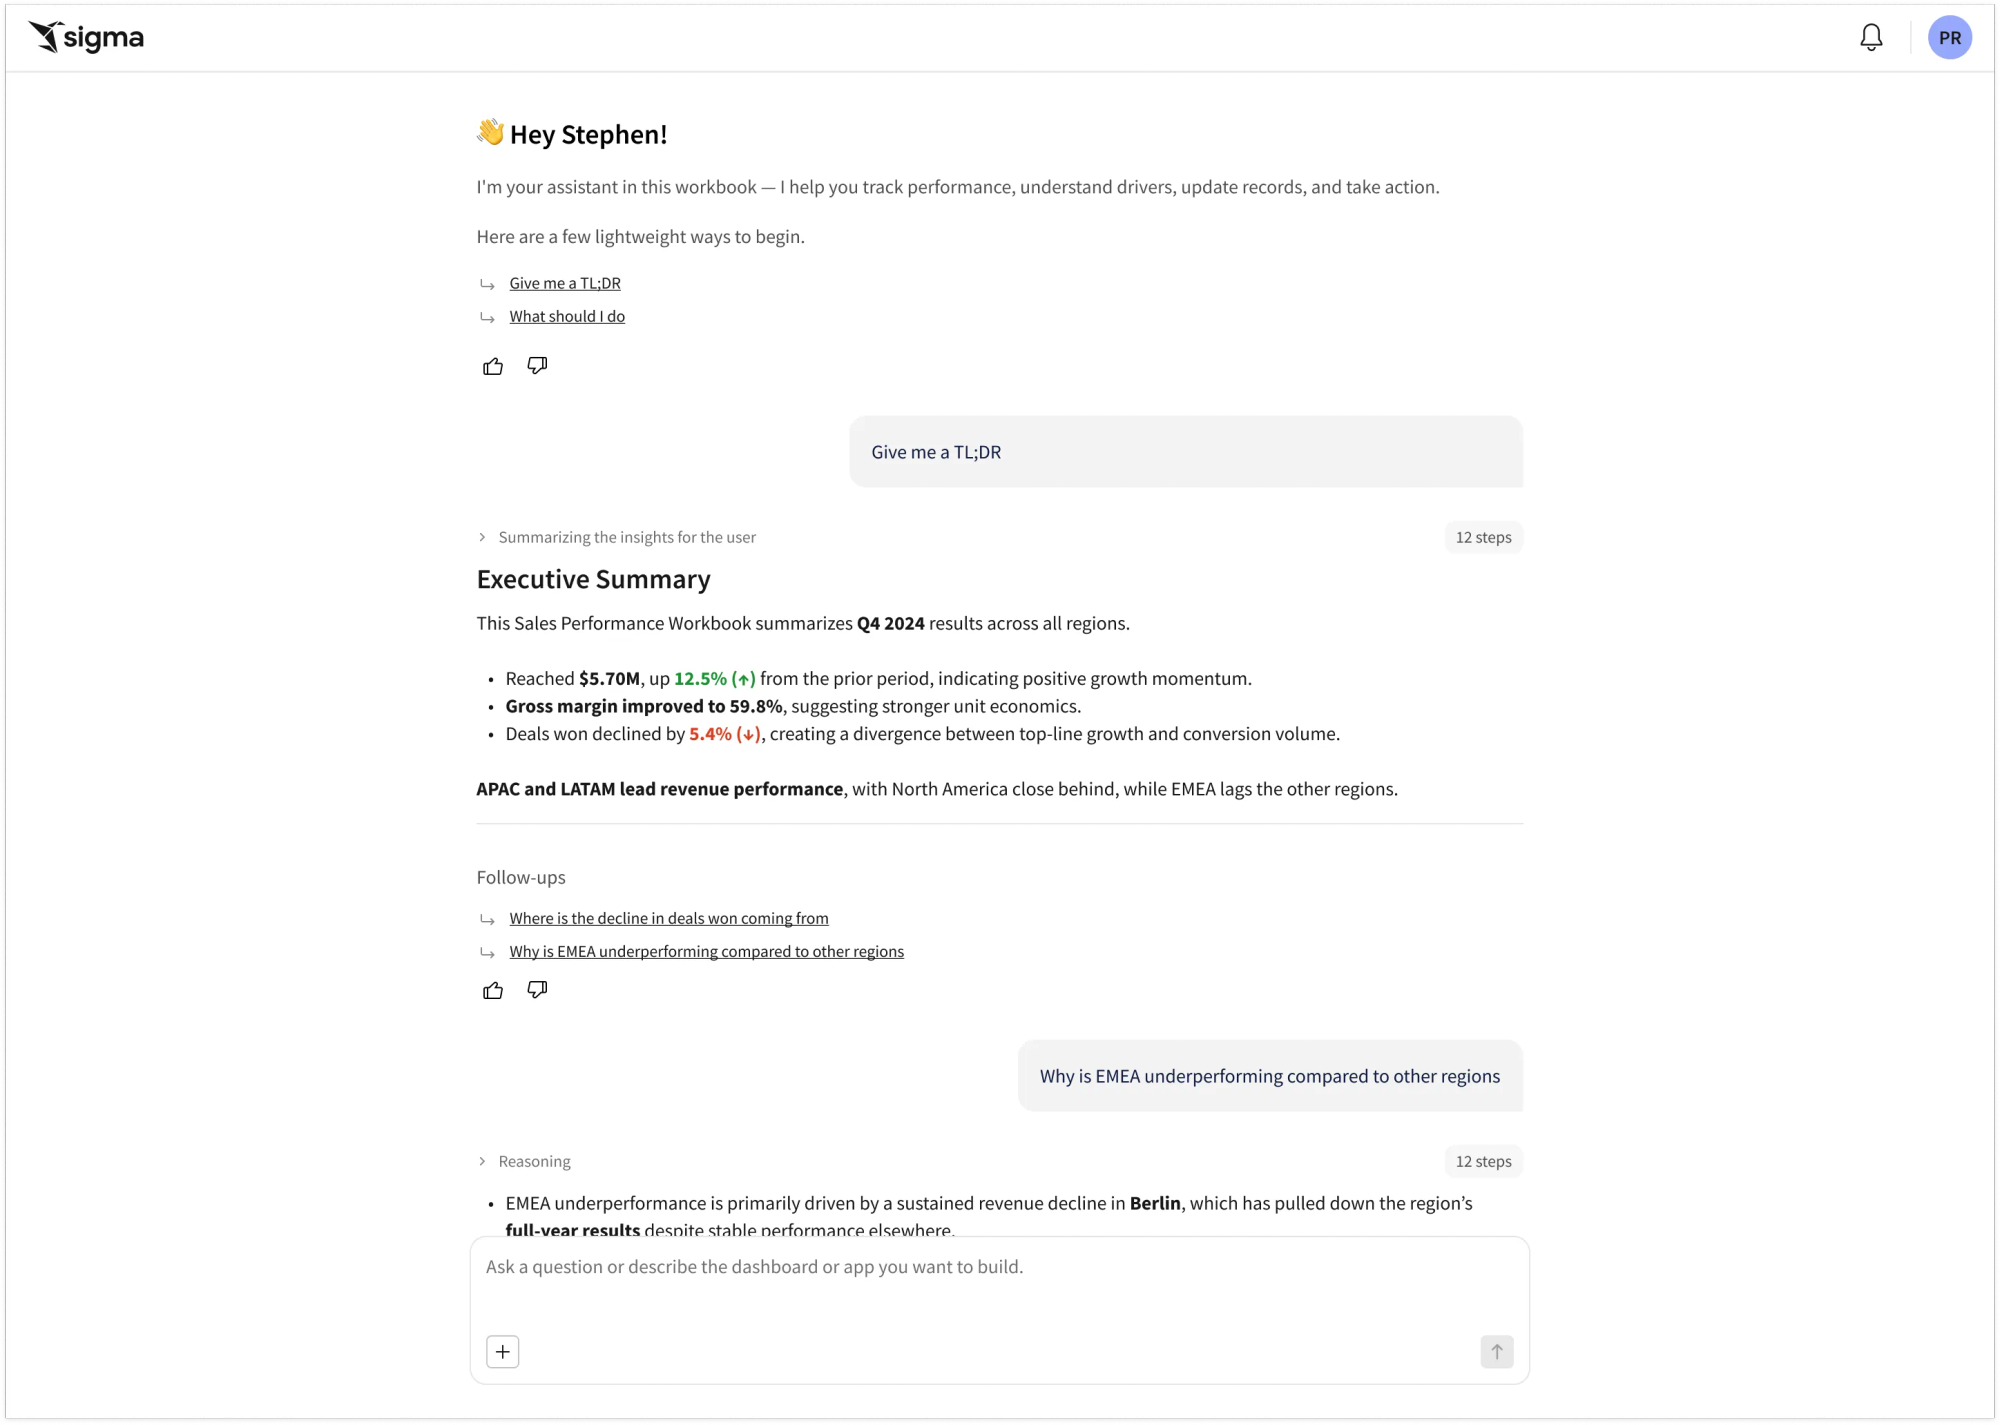
Move beyond rigid lookups with a conversational interface that feels human. Ask Sigma enables teams to go from a simple question to full-scale analysis in seconds.
- Seamless Actionability: Extend your answers into analysis. Instantly transition from a chat response to drilling, filtering, or building within an app or workbook.
- Conversational Follow-ups: Refine your analysis through natural language. Ask follow-up questions to explore new dimensions without starting over.
- Agent Integrations: Bring your intelligence. Integrate your pre-built warehouse agents to maximize the value of your technology investments.
Built for the Builder
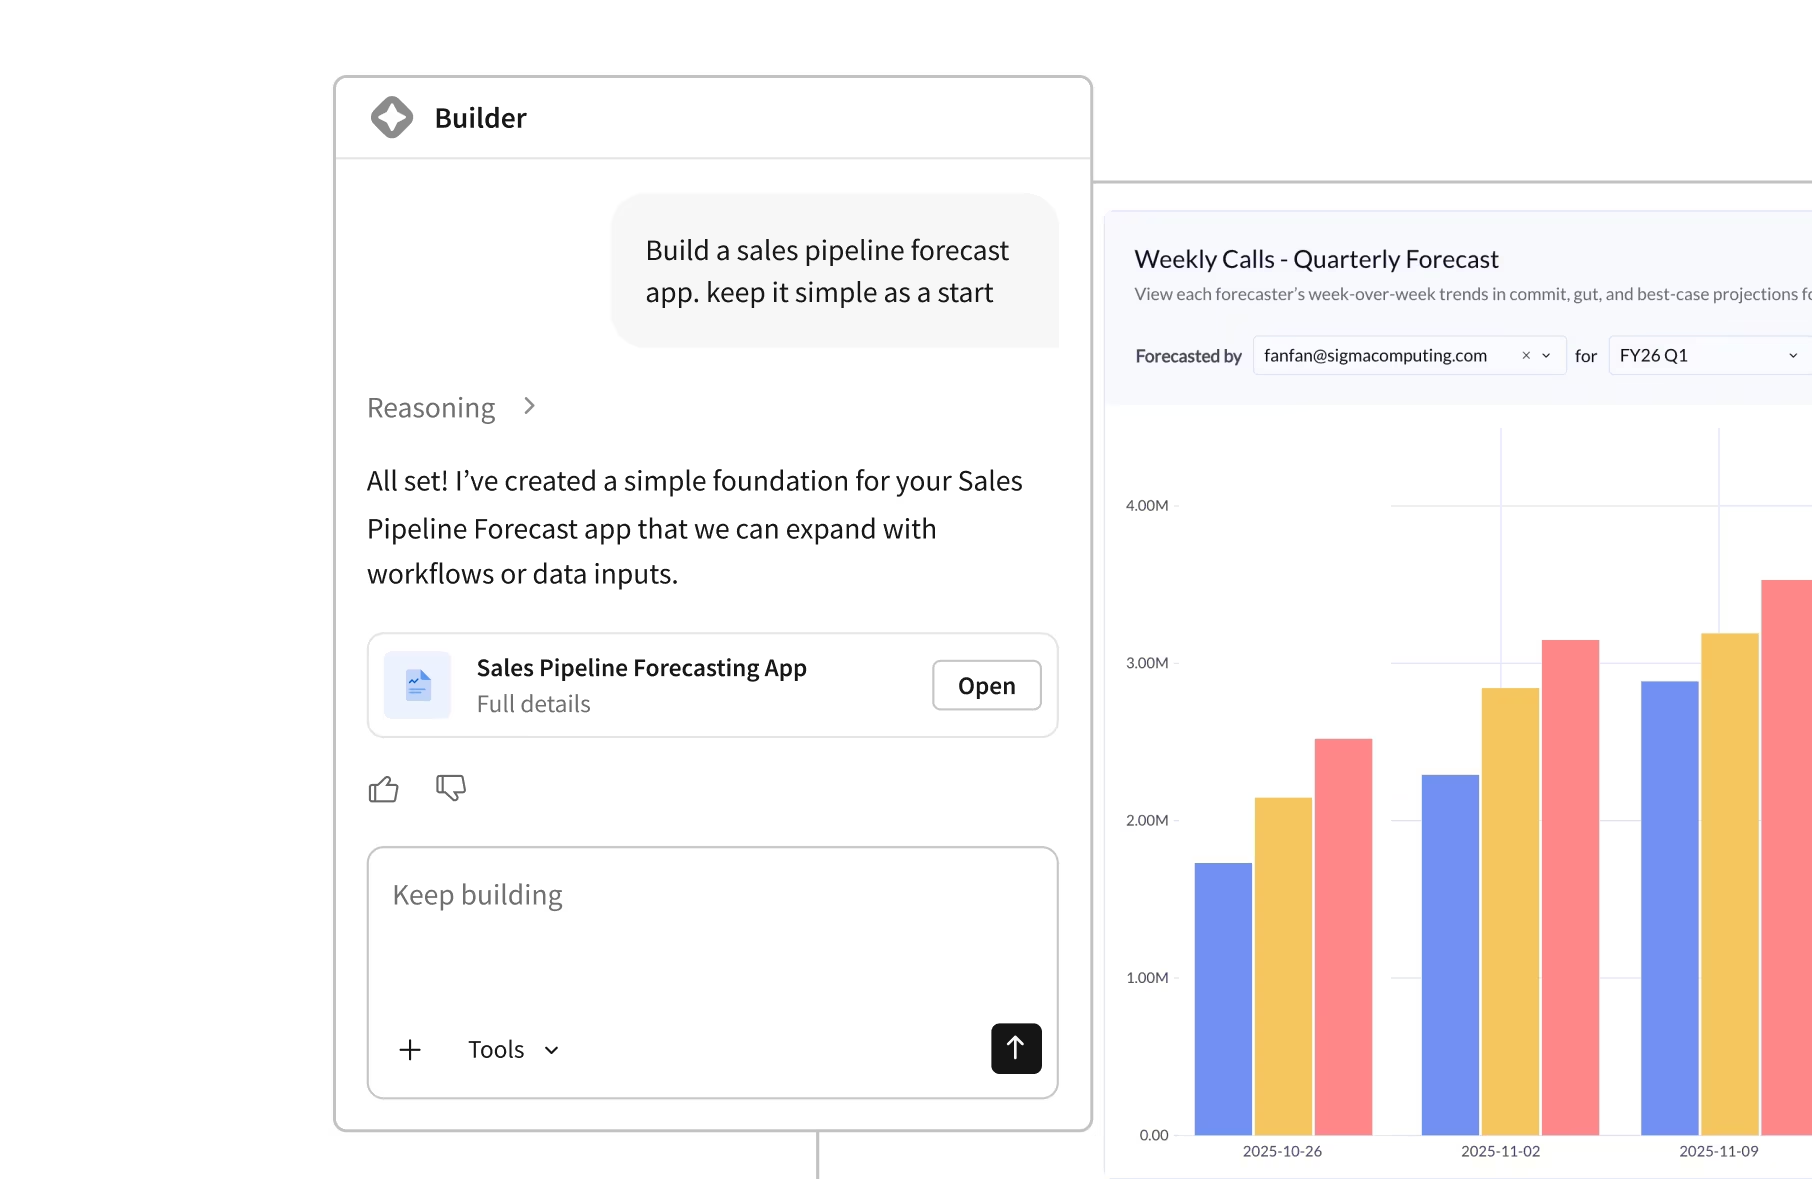
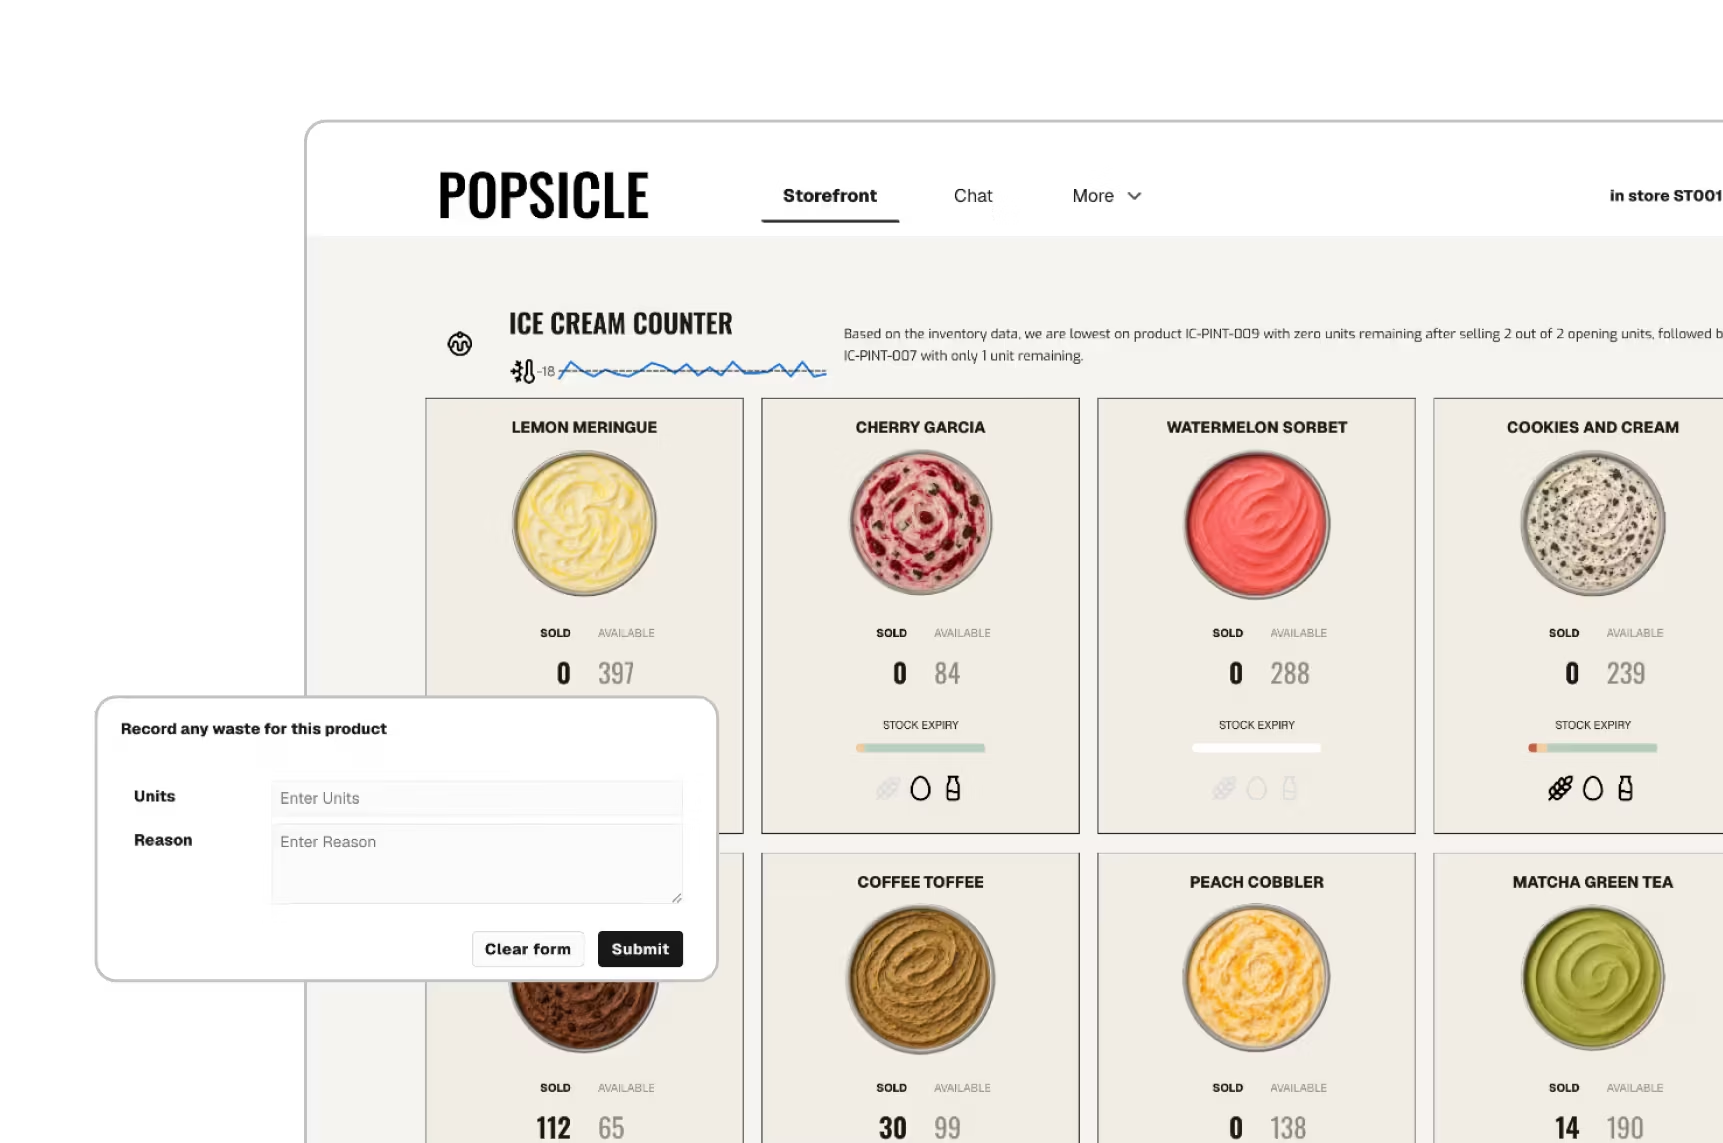
Reclaim productivity and safely scale business user output with AI Apps

 Customer Story
We've been able to see people create new dashboards in relatively quick time periods. Now we're seeing people say, 'Oh, I just have this idea. Let me go see how it looks in the data.'


Related Resources

Leading with Data: The Data Analyst’s Path to Leadership
Learn how data analysts become leaders. Watch Sigma experts Luke Stanke and Joe Thomas share a practical playbook to prioritize high-impact work, set boundaries, and lead data teams that drive real business results.

When In Doubt: KPI, Bar Chart, Table
Most teams don’t need complex charts. Use a KPI, a bar chart, and a table to ship faster, explain the why, and help people decide.

QuickStart Fundamentals: Pivot Tables
Learn how to use Sigma to explore and analyze data using pivot tables.
Everything you need to analyze, report, and act
One platform for dashboards, reports, embedded analytics, and AI-powered insights.

Business Intelligence FAQs
Practical questions teams ask when rolling out Sigma as the BI layer on top of a governed cloud data warehouse—data access, metric definitions, and permissions.