Drive powerful insights with a single click
What are Cross-Chart Interactions?
Cross-chart interactions refer to the ability to connect and interact with multiple charts in Sigma. These interactions allow users to explore and analyze data across multiple visualizations simultaneously.
Why are they important?
Cross-chart interactions are a powerful tool for data visualization because they allow users to explore data faster and in greater detail, uncovering patterns and relationships that may not be apparent in individual charts.
What do they allow me to do?
There are a few different implementations, but in general, they allow users to select a chart element in one chart that triggers a filter to be applied to all other charts on the page, displaying only the relevant data.
Can you give me an example?
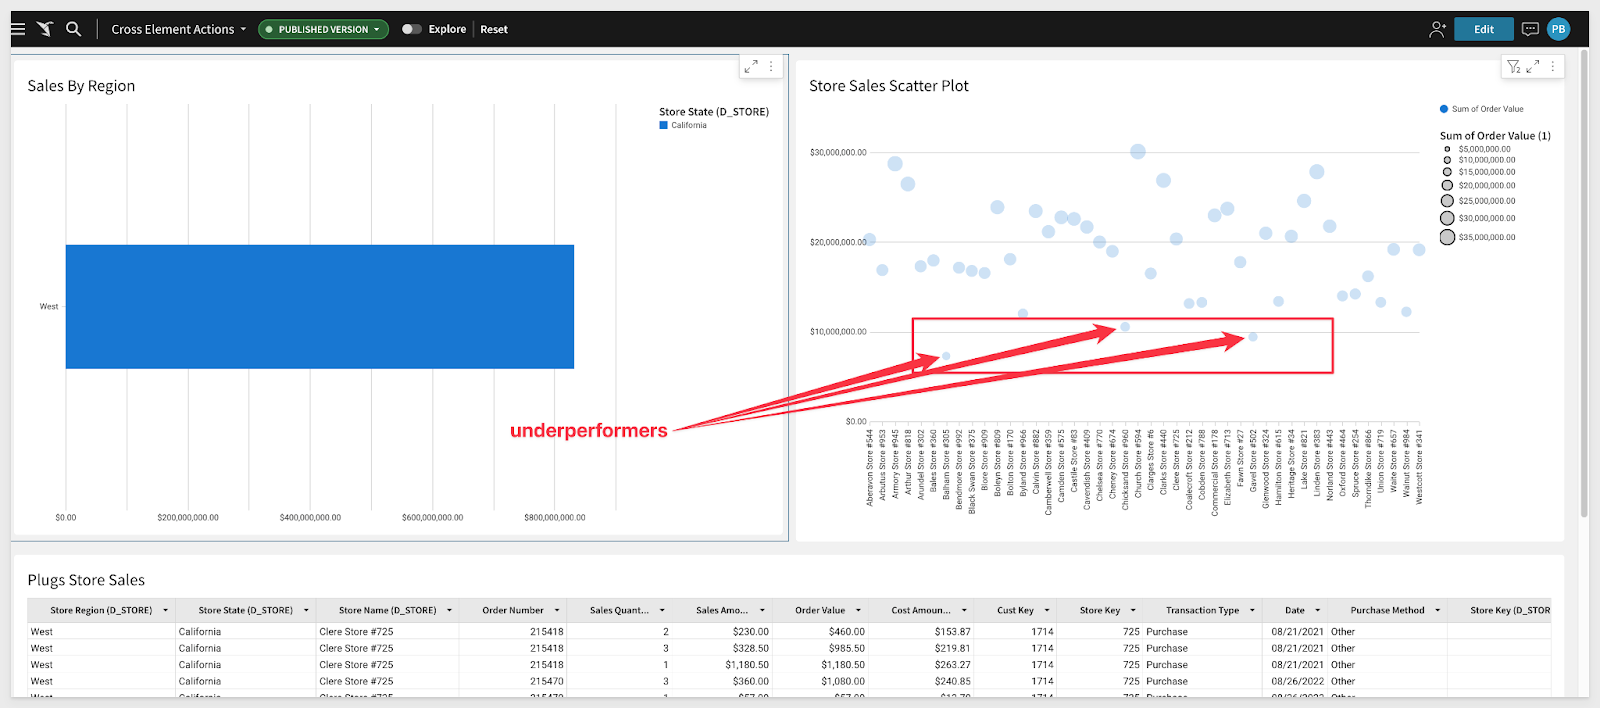
There are many use cases for this; let’s consider a user who is looking at a bar chart displaying sales grouped by geographic region, and another chart (a scatter plot) that shows sales by store name.
California is the largest source of revenue and the user wants to know which stores are underperforming.
Cross-chart interactions allows the user to just click the bar chart bar for California…

…and the scatter plot chart immediately makes it apparent which stores are underperforming:

Can I also use a drop-down filter and other page controls with this?
Absolutely. All the standard Sigma page controls are available to give users a highly functional, browser-based working environment.
Learn more about Sigma Page Controls.
How is this different from other vendors' implementations?
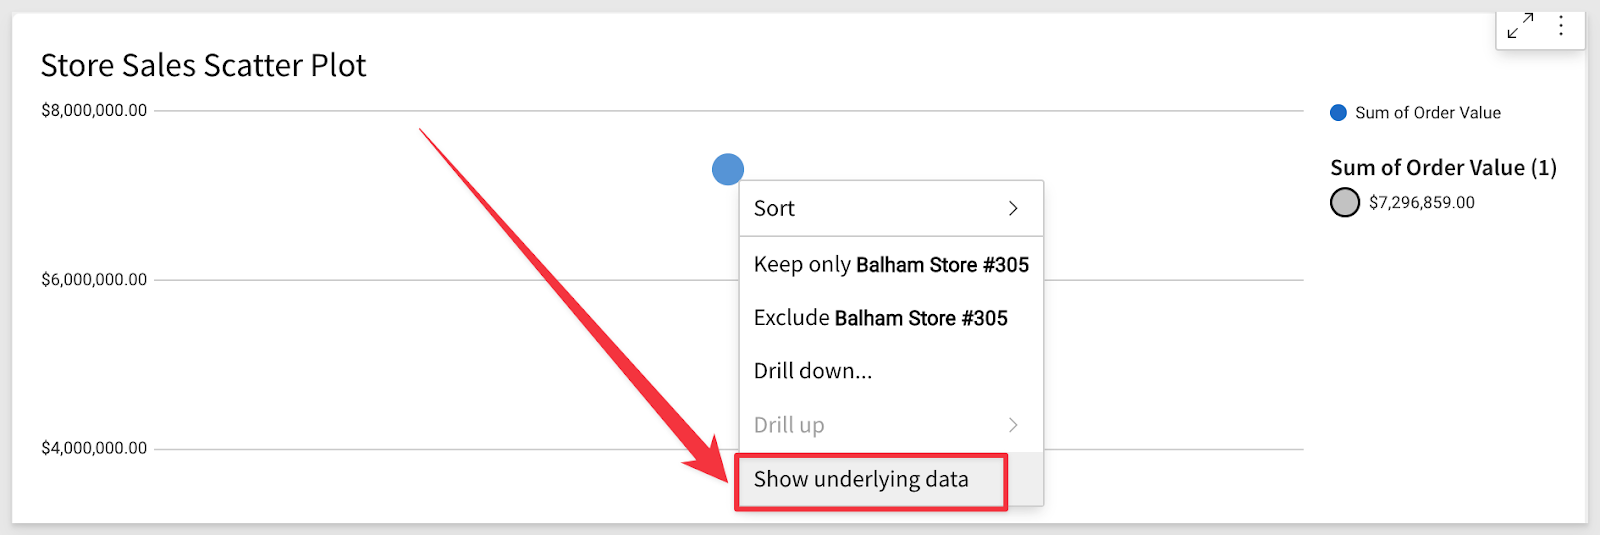
At first glance, this is a pretty standard feature and other BI vendors support it one way or another. But Sigma’s implementation is fundamentally different in that you do not have to know where the user wants to go ahead of time. You can think of chart interactions as one way of providing users a “jumping-off” point where they can then explore their data in any way they want. Sigma’s drill-anywhere functionality allows users to work with ALL the data at the lowest level they want. Continuing on the previous example, the user may want to look at the row-level detail for the lowest performing store. One click to select the store from the scatter plot and another to select “Show underlying data,” and the row-level detail is displayed.


More questions? Read our top 20 questions about Sigma here.


